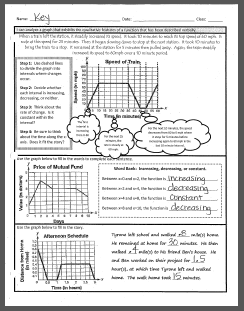
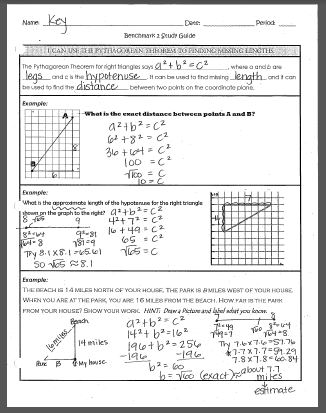
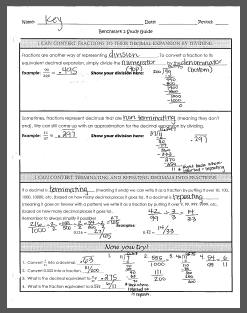
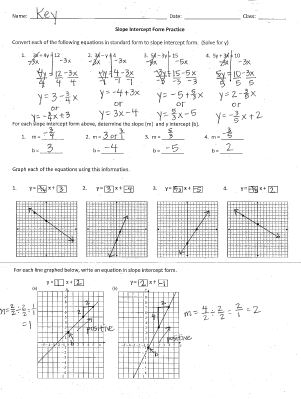
Today, we worked on a study guide from some more recent topics: scatter plots, frequency tables, and distance/time graphs. Please click on the image to the left to check your study guide answers before class tomorrow. At the beginning of class, we can answer any questions you may have before we review linear functions. Your benchmark is only two days away, please spend some time studying the guides from last week as well as today. All are posted on this blog. The more you study, the more prepared you will be for your benchmark. Remember, the quarter ends in less than two weeks. It is important that you finish strong!
0 Comments
Here is your benchmark review for today. Remember the graphic organizer in the room that shows that relations can be divided into those that are functions (each input has only one output) and those that are not functions (x repeats with two different y values). Within the functions, you can divide into those that are linear (have a constant rate of change) and those that are nonlinear (does not have a constant rate of change). The rate of change is the slope which we will compare in the next review on Monday. Take some time this weekend to review and study the study guides from this week. They are all here on the blog. Your benchmark is next week :) Here is the answer key to the study guide for Pythagorean Theorem and Volume that you were supposed to finish for homework tonight. Use it to check your answers after you've solved them on your own. Remember to keep up with this study guide AND the one from yesterday to use as you study for your math benchmark that is NEXT WEDNESDAY.
Here are our guided notes and practice problems from our review today. Your homework is to complete the "You Try" sections at the bottom of each page. If you really struggled with our quick review of long division, you can click here for some guided and independent practice. Yesterday, we gave you a review problem that you really struggled with. Watch this video for a reminder of how to use the Pythagorean Theorem to find distance. Here are a few videos to help you understand two-way tables. Enjoy! Today in class we introduced the idea that data points don't have to be in a perfectly linear order for us to say that they have some kind of linear relationship. As we continue to work with this idea tomorrow, we'll see that we can "fit" a line to scatter plots that show linear trends, and we can then use those lines to help us predict unknown information and answer questions relating to real world scenarios. For a recap of what we did in class today and a little bit of a preview for tomorrow, check out the videos below by clicking on the images.
We will be taking a quiz in class tomorrow over equations in slope-intercept form. The classwork from today is your homework for tonight, and it is also your study guide for the quiz tomorrow. If you want to check you answers you can download the key by clicking the image below. Don't forget to check out the videos in some of our older blog posts for good studying too!
This week we've been working through a packet of notes and examples about equations written in slope-intercept form. If you've missed any of the days, you can download the completed packet here to catch your's up.
Today in class we looked at how to graph linear functions from various given information (for example: from two coordinate points, from a point and the slope, and from the equation). Here is the answer key to the practice we did in class.
|
8th Grade Math TeamArchives
April 2015
Categories
All
|