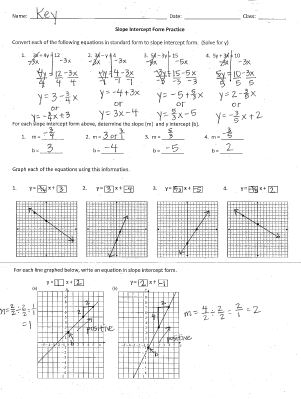
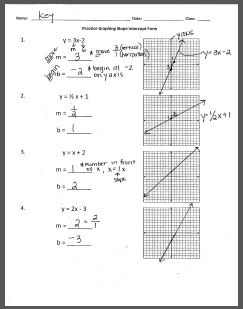
We will be taking a quiz in class tomorrow over equations in slope-intercept form. The classwork from today is your homework for tonight, and it is also your study guide for the quiz tomorrow. If you want to check you answers you can download the key by clicking the image below. Don't forget to check out the videos in some of our older blog posts for good studying too!
This week we've been working through a packet of notes and examples about equations written in slope-intercept form. If you've missed any of the days, you can download the completed packet here to catch your's up.
Today in class we looked at how to graph linear functions from various given information (for example: from two coordinate points, from a point and the slope, and from the equation). Here is the answer key to the practice we did in class.
In class today, we learned how to graph a line using its equation in slope intercept form. See below for our guided notes and examples from class. You can also click on the answer key to check your practice from today.
Today in class, we looked at how to rewrite equations that two variables by solving for one (y) in terms of the other (x). This concept will be very helpful when we start working with linear equations next week, but if you didn't quite get how to do it in class today then watch the video in the link below for some help.
When you come back on Tuesday we are going to start looking at linear equations, specifically when they are written in what is called "slope-intercept form". Basically, all that means is that the linear equation has been solved to say y = something (specifically it should say y=mx+b, but we'll talk about what that means on Tuesday). If you want a sneak peak to get ahead a little, there's a link to a video for that as well. Enjoy your long weekend! The first new concept we have learned this semester is about finding the slope (or rate of change) of a linear function. Remember that we've said any set of x's and y's can be called a relation, but only some relations are functions; specifically, the relations where no x (or input) is repeated with different y's are called functions. Then we said that we can look only at a set of functions and then determine whether each one is a linear function or a nonlinear function (remember that linear functions make a straight line on a graph, and they have a constant rate of change or slope). Once we know that a function is linear, we can then find its rate of change or slope. So far, we've specifically looked at how to find this slope from a table of values and from a graph. For a review over finding the slope, click on the pictures below to get a video explaining how to find slope.
|
8th Grade Math TeamArchives
April 2015
Categories
All
|